Contents
- Introduction
- Join the VisAD mailing list
- How to get VisAD
- Documentation
- Prerequisites
- The VisAD Spread Sheet
- Running VisAD in a Browser
- The VisAD Python Scripting Language
- Support for File Formats
- Running VisAD Using NexusRMI
- Unidata's Integrated Data Viewer using VisAD
- VisBio for Biological Visualization and Analysis using VisAD
- Novel Displays for AERI Sounder Data
- Collaborative Milky Way Galaxy Designer
- Collaboration Between an ImmersaDesk and a Workstation
- Prototype Environmental Hydrology Workbench
- The JMET Interactive Meteorology System
- Collaborative Computational Steering of a Shallow Fluid Model
- Other Application Examples
- VisAD Bibliography
Introduction
VisAD is a Java component library for interactive and collaborative visualization and analysis of numerical data. The name VisAD is an acronym for "Visualization for Algorithm Development". The system combines:- The use of pure Java for platform independence and to support data sharing and real-time collaboration among geographically distributed users. Support for distributed computing is integrated at the lowest levels of the system using Java RMI distributed objects.
- A general mathematical data model that can be adapted to virtually any numerical data, that supports data sharing among different users, different data sources and different scientific disciplines, and that provides transparent access to data independent of storage format and location (i.e., memory, disk or remote). The data model has been adapted to netCDF, HDF-5, FITS, HDF-EOS, McIDAS, Vis5D, GIF, JPEG, TIFF, QuickTime, ASCII and many other file formats.
- A general display model that supports interactive 3-D, data fusion, multiple data views, direct manipulation, collaboration, and virtual reality. The display model has been adapted to Java3D and Java2D and used in an ImmersaDesk virtual reality display.
- Data analysis and computation integrated with visualization to support computational steering and other complex interaction modes.
- Support for two distinct communities: developers who create domain- specific systems based on VisAD, and users of those domain-specific systems. VisAD is designed to support a wide variety of user interfaces, ranging from simple data browser applets to complex applications that allow groups of scientists to collaboratively develop data analysis algorithms.
- Developer extensibility in as many ways as possible.
VisAD was written by programmers at the SSEC Visualization Project at the University of Wisconsin-Madison Space Science and Engineering Center, by programmers at the Unidata Program Center, by programmers at the National Center for Supercomputer Applications, by programmers at the Australian Bureau of Meteorology, by programmers at the National Center for Atmospheric Research, and by programmers at the Canadian National Research Council.
Join the VisAD mailing list
There is a VisAD mailing list at visad@unidata.ucar.edu (visad-list@unidata.ucar.edu works too). To subscribe to it send an email message to visad-join@unidata.ucar.edu. You can also subscribe or unsubscribe on the Unidata Mailing List web page.Search Unidata's visad-list archive.
You cannot post to this list unless you are subscribed, and your posts must come from the same address that you subscribed as. If you are having trouble posting, then subscribe using the address that appears in the "from" field of messages you send. If you want to unsubscribe from your old address and do not remember it, then subscribe as your new address and send 'who visad' (or 'who visaddigest') to majordomo@unidata.ucar.edu. It will send you a list of subscribed addresses that you can search for your old address (and then send 'unsubscribe visad old@address' to majordomo@unidata.ucar.edu).
How to get VisAD
LAST UPDATEDVisAD is freely available including complete source code, documentation and application examples from:
- Download the VisAD source code as a jar file (you may need to click on the jar file with the SHIFT key held down to get your browser to load it).
If you do not want to compile the VisAD source code, the compiled classes are also available as visad.jar (you may need to click on the jar file with the SHIFT key held down to get your browser to load it). If you want to run the example applications using visad.jar, see the "Building VisAD" Section INSTALL file.
Here's a link to a super-easy Windows Installer for VisAD, Jython, JRE and Java3D.
Documentation
The first document to look at is Ugo Taddei's VisAD Tutorial. Thanks to Ugo and to Tom Whittaker for this great new tutorial.Other tutorials include:
- The VisAD Data Model Tutorial, which is useful for people just getting started
- The VisAD Python Tutorial, which explains an easy way to use VisAD from Python scripts
- The VisAD Collaboration Tutorial, which provides step-by-step instructions for building collaborative applications, and for converting existing applications to support collaboration (its all really quite simple)
- The VisAD DataRenderer Tutorial, which explains how to write custom extensions of the DataRenderer class (these actually construct depictions of Data objects in Displays, and modify Data objects in response to direct manipulation)
- The VisAD Event Tutorial, which is useful for writing applications with complex user interfaces, multiple threads and distributed computing
The best way to learn any library is to study example applications that use the library, then to build your own application by modifying one or more of these existing applications. The Developers Guide describes numerous application examples that are distributed with the VisAD source code. If you have questions or problems, send email to the VisAD mailing list.
Other doumentation includes:
- The VisAD FAQ
- Jar file of VisAD javadoc
- Online browse of VisAD javadoc
- Search Unidata's visad-list archive
- The VisAD INSTALL file for installation instructions
- The VisAD README_native file for installing native code
- A list of Unit names and abbreviations for use in VisAD
- The procedure for testing and releasing VisAD to the ftp server
- Curtis Rueden's programming examples
Prerequisites
VisAD requires Java which is freely available from Oracle's Java web page. Displays may be generated with either Java2D (included in Java) or Java3D, which is freely available from Oracle's Desktop Technologies web page.If you want to use the VisAD Python scripting language then you will need to install Jython.
If you want to use the VisAD matrix operations in the visad.matrix package, then you will need to install Jama.

|
The VisAD visualization system uses the mature Java functionality of the JDK platform, including Java3D, Java2D and Java RMI. We at the SSEC Visualization Project of the University of Wisconsin believe that the JDK defines the evolution of the Internet as a new communications medium. Java3D and Java2D define the state-of-the-art for computer image generation, and Java RMI is a quantum leap for collaborative user interfaces and distributed computing. |
McIDAS-V
McIDAS-V is the 5th generation of McIDAS software, based on VisAD and Unidata's IDV. McIDAS-V includes HYDRA, the HYperspectral-viewer for Development of Research Applications, also based on VisAD, to enable scientists to explore hyperspectral data.Here's the story of why the new version of McIDAS based on VisAD makes me so happy.
The VisAD Spread Sheet
The VisAD Spread Sheet is a handy way to visualize and compute with netCDF, HDF-5, FITS, GIF, JPEG, Vis5D, McIDAS and HDF-EOS files, that does not require any programming. Of course, the full flexibility of VisAD is only accessible to programmers using the class library, but the Spread Sheet is a useful tool and a nice illustration of what you can do programming with the VisAD class library.Running VisAD in a Web Browser
The visad.browser package runs in Java applets and supports full interaction with VisAD displays running on servers. Run 'java Test68' in visad/examples and 'appletviewer viewer_applet.html' in visad/browser for an example. To use this in web browsers, see the README.browser file.The VisAD Python Scripting Language
VisAD supports a simple Python-based scripting language for accessing its data analysis and visualization capabilities. See the VisAD Python Tutorial for more information.Support for File Formats
VisAD includes support for accessing data in various file formats, including:- ASCII - see the README.text file for more information
- Bio-Rad PIC
- BMP
- DICOM
- DODS
- F2000
- FITS
- GIF
- HDF-5 - see the README_native file for instructions for installing the HDF-5 native library - also see NCSA's description of The VisAD HDF-5 Data Adapter
- HDF-EOS - see the README.hdfeos file for instructions for installing the HDF-EOS native libraries
- JPEG
- LUT
- McIDAS
- McIDAS ADDE
- netCDF
- PGM
- PNG
- Quicktime - through the QuickTime for Java package
- ROI
- Shape - distributed by Unidata with their MetApps system
- TIFF - including ZIP-compressed TIFF
- Vis5D
- VisAD - binary data format, as well as serialized visad.Data objects
Hershey Fonts
VisAD is distributed with a number of Hershey fonts, but more are available as a ZIP file. To use any of these additional fonts, you should put the individual font file(s) into the visad/util directory and be sure to use the .jhf filename extension.Running VisAD Using NexusRMI
You can compile and run VisAD using NexusRMI, an alternate implementation of RMI (Java's distributed object technology) based on the Nexus high-performance communication system. See the README.nexusrmi file for compilation and running instructions.Unidata's Integrated Data Viewer using VisAD
The Unidata Program Center (part of UCAR and an authoring institution of VisAD) has released their Integrated Data Viewer (IDV). The IDV fuses data from a wide variety of environmental sources together in 2-D and 3-D earth views. It also includes a VisAD adapter for ArcInfo Shape files.VisBio for Biological Visualization and Analysis
VisBio is a biological visualization tool built on VisAD and designed to allow easy visualization and analysis of 4-D multispectral data--that is, stacks of slices of biological data with multiple color values, animated across time.Novel Displays for AERI Sounder Data
The Aeri.java program in the visad/aeri directory is the start of an application for a novel way to visualize AERI sounder data. To try it, create a data sub-directory in the visad/aeri directory, and download these ten .cdf files into visad/aeri/data (you may need to click on these files with the SHIFT key held down to get your browser to save them on your disk). These are files for five AERI instruments and five associated wind profilers, for 12 Jan 2000. Then run:
java -mx256m visad.aeri.AeriPlease ignore the warning messages from the file reader. And here's a screen shot of the Aeri application, showing an hour's advection of mixing ratio from five sounding locations in Oklahoma and Kansas.
Collaborative Milky Way Galaxy Designer
Here's a screen shot of a collaborative Milky Way galaxy design application using VisAD:
The goal is to adjust parameters of the Milky Way galaxy to get the H-alpha sky map (shown in a flat map projection and on a sphere) to match observations made from Earth. Users can drag the red point in the 3-D galaxy density display and see a graph of density versus distance along a line between the red point and the sun. This application serves as a good example of how to build collaborative applications using VisAD and is freely available including complete source code as part of the VisADF distribution.
See the README.benjamin file for further instructions.
Collaboration Between an ImmersaDesk and a Workstation
We produced a demonstration of collaboration between an ImmersaDesk and a workstation for the NCSA Alliance '98 conference. This combined VisAD, NCSA Habanero, and an adaptation of Java3D to the ImmersaDesk by Steve Pietrowicz and Chris Heistad of the NCSA Java3D Group.This demonstration is based on the GoesCollaboration application written using VisAD. GoesCollaboration serves as a good example of how to build collaborative applications using VisAD. It is included in the VisAD source distribution in the visad/paoloa directory. See the README.paoloa file for more information.
Click here for a screen shot of this application.
Prototype Environmental Hydrology Workbench
Here's a screen shot and description of the prototype environmental hydrology workbench demonstrated at Supercomputing 98, and developed as part of the NCSA Environmental Hydrology team effort. It uses VisAD and Globus.The JMET Interactive Meteorology System using VisAD
Check out the initial release of the JMET Interactive Meteorology System in the visad/jmet directory of the VisAD distribution. It provides interactive exploration of model output in netCDF files. In the future it will be a full functionality interactive meteorology system. JMET source is included in the VisAD source distribution.Collaborative Computational Steering Example
The 2-D shallow fluid model lets you experiment with physical and numerical parameters of the simulation and visualize the consequences. It lets groups collaborate in these experiments. It is included in the VisAD source distribution in the visad/aune directory. See the README.aune file for more information.Australian Bureau of Meteorology Applet Demonstrating VisAD Map Projections
Check out Geoff Freeman's Applet that demonstrates how to support dynamic map projections using VisAD.
RAFT for statistics visualization using VisAD
Adele Cutler and Leo Breiman have developed RAFT (RAndom Forest Tool) for visualizing random forest analysis, using VisAD.
HidroSIG for GIS using VisAD
HidroSIG is a GIS that supports raster and vectorial maps with modules oriented to the hydrological analysis, time series, remote sensing and more. It has been made 100% in java using VisAD like its graphics library and using MySQL like its DBMS.
Collaborative Geographic Visualization from the Penn State GeoVISTA Center
The GeoVISTA Center of the Pennsylvania State University is creating collaborative visualizations using VisAD and the University of Jena's DEMViewer. The GeoVISTA Center's work includes novel and useful interfaces for studying cyclic temporal phenomena and a locally-developed networking tool called TalkServer to manage collaboration.
Access to geolocated satellite data from GVAR, GOES, GMS and Meteosat
VisAD now provides access to data from GVAR and GOES (U.S.), GMS (Japanese) and Meteosat (European) weather satellites. This links VisAD's CoordinateSystem mechanism with McIDAS satellite navigation to geolocate the images so that they can be overlaid with data from numerical models and other sources. Here's a shot from an animated global mosaic created from these satellites. See the visad/examples/SatDisplay.java program for an example of how to use this capability.
Rainfall Estimation Custom SpreadSheet
The Rain.java program in the visad/rabin directory is the start of an application for estimating rainfall from satellite images. It features links between cells for panning and zooming, for color tables, and for a custom cursor for reading out pixel values. To run the Rain program, download the data set in the dallas_2.5km_v5d.nc file (you may need to click on this file with the SHIFT key held down to get your browser to save it on your disk), then run:
java visad.rabin.Rain dallas_2.5km_v5d.nc
Hyper-spectral Data from NEST-I
The Nasti.java program in the visad/paoloa directory is the start of an application for analyzing hyper-spectral data from the NEST-I sensor. To try it, download a NEST-I data set in the smc3ars1.nc file (you may need to click on this file with the SHIFT key held down to get your browser to save it on your disk), then run:
java visad.paoloa.Nasti smc3ars1.ncClick and drag the right mouse button on the yellow cursor in the image display to select a pixel for the spectral display. Click and drag the right mouse button on the red cursor in the spectral display to select a wave number for the image display.
Interactive Earth Globe Example
Steve Emmerson has created an interactive globe display of Earth topography and bathymetry using VisAD. It is included in the VisAD source distribution as the visad/examples/Earth.java class. You'll need to download the netCDF topography file into your visad/examples directory (you may need to click on this file with the SHIFT key held down to get your browser to save it on your disk), then run:
java -Xmx64m Earth lowresTerrain.nc
Image Stretching Applet Example
Curtis Rueden has written an image stretching applet using VisAD.
Interactive Curve and Surface Fitting
The Spline and Spline2D applications distributed with VisAD in the visad/paoloa/spline directory let you experiment with various statistical curve and surface fitting algorithms. The red dots are draggable, to experiment with the effect of noise on fitting algorithms.VisAD Bibliography
-
Java distributed components for numerical visualization in VisAD
William Hibbard, Curtis Rueden, Steve Emmerson, Tom Rink, David Glowacki, Tom Whittaker, Don Murray, David Fulker, John Anderson, Communications of the ACM 48, No. 3, 2005, 98-104. -
Building 3-D User Interface Components Using a Visualization Library
W. Hibbard, Computer Graphics 36, No. 1, 2002, 4-7. -
New Ways, in Java, of Visualizing the Same Old Data
D. Murray and D. Fulker, AGU 2000 -
An example of Unidata's future in new software: the VisAD component
architecture for collaborative data analysis and visualization
W. Hibbard, Preprints, Conf. Interactive Information and Processing Systems for Meteorology, Oceanography, and Hydrology, 2000, 162. - Collaborative visualization and computation in the earth sciences
using VisAD.
W. Hibbard, S. Emmerson, C. Rueden, T. Rink, D. Glowacki, N. Rasmussen, D. Fulker and J. Anderson, Preprints, Conf. Interactive Information and Processing Systems for Meteorology, Oceanography, and Hydrology, 1999, 478-480. -
VisAD: Connecting people to computations and people to people
W. Hibbard, Computer Graphics 32, No. 3, 1998, 10-12. -
Java and the World Wide Web: The Right Choice for Interactive Systems
W. Hibbard, J. Anderson, and B. Paul, Preprints, Conf. Interactive Information and Processing Systems for Meteorology, Oceanography, and Hydrology, 1997, 172-173. -
A Java and World Wide Web Implementation of VisAD
W. Hibbard, J. Anderson, and B. Paul, Preprints, Conf. Interactive Information and Processing Systems for Meteorology, Oceanography, and Hydrology, 1997, 174-177. -
Visualizing Scientific Computations: A System based on
Lattice-Structured Data and Display Models
W. Hibbard, PhD Thesis, Univ. of Wisc. Comp. Sci. Dept. Tech. Report, #1226, 1995. -
Interactive Visualization of Earth and Space Science Computations
W. Hibbard, B. Paul, D. Santek, C. Dyer, A. Battaiola, and M-F. Voidrot-Martinez, Computer 27, No. 7, July 1994, 65-72. -
A Lattice Model for Data Display
W. Hibbard, C. Dyer, and B. Paul, Proc. IEEE Visualization '94, 1994, 310-317. -
Display of Scientific Data Structures for Algorithm Visualization
W. Hibbard, C. Dyer, and B. Paul, Proc. IEEE Visualization '92, 1992, 139-146.
VisAD Version 1.1 (written in C)
The earlier version VisAD, written in C, has been freely available for years and also has a web page.
To contact the authors...
Please send email to visad@unidata.ucar.edu.Postal mail can be sent to:
Bill Hibbard
Space Science and Engineering Center
University of Wisconsin - Madison
1225 W. Dayton St.
Madison, WI  53706
If you create extension packages to VisAD we will be happy to add links to your web page describing and serving your extensions.
Disclaimers
VisAD is free software and as such we do not provide real support for it. However, we will be happy to answer short questions and/or help with minor problems (preferably by email).Java, JDK, and Jump to Java Launch Logo are trademarks or registered trademarks of Sun Microsystems, Inc. in the U.S. and other countries.
VisAD Developers in Melbourne
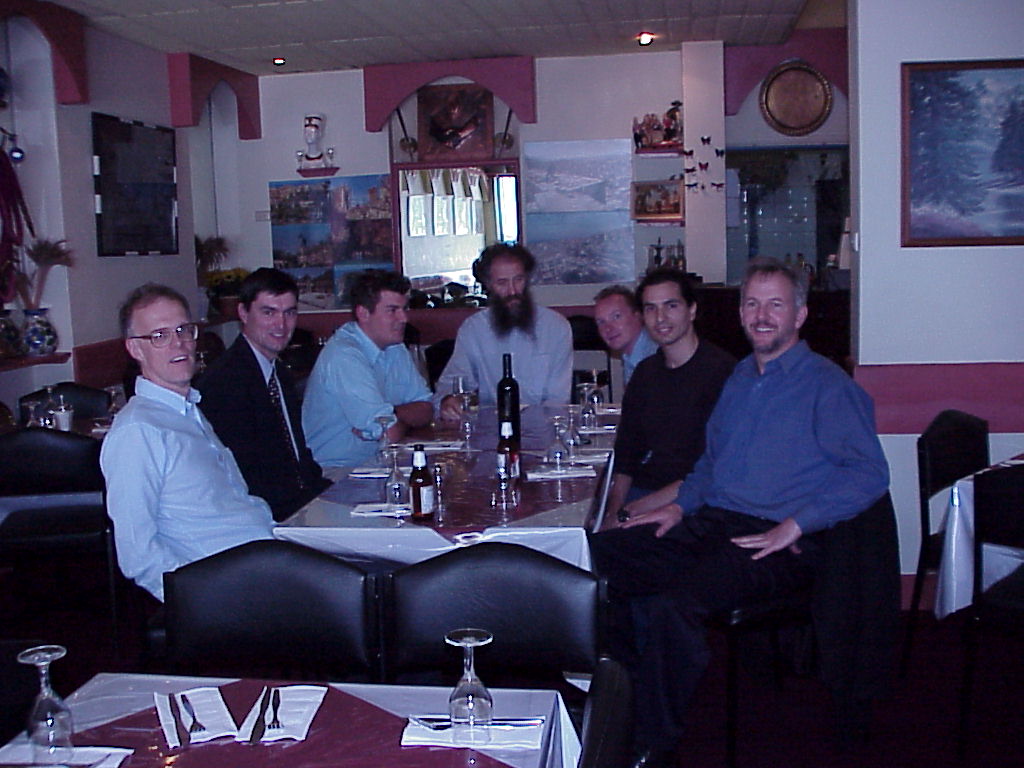 (Bill Hibbard, Andrew Donaldson, Luke Matthews, Geoff Freeman,
Rob Hackett, Jim Koutsovasilis, James Kelly)
(Bill Hibbard, Andrew Donaldson, Luke Matthews, Geoff Freeman,
Rob Hackett, Jim Koutsovasilis, James Kelly)
P.S.
We also have a home page for Vis5D.And here is the original VisAD Home Page.